
Contents
Let's kick things off with a confession: most brands pull one number off their podcast dashboard (the download count), drop it into a slide for leadership, and close the tab until next month (I know, you've done this).
And look, downloads have their place. But if that's the only way you're touching your data, you're ignoring your best content ideas every single time you open your podcast analytics dashboard.
Because your data isn't just a performance summary to report on; it's also a brief for your next episode. But sadly, so many marketers aren't using it for this purpose.
So, that's the shift I want to make the case for in this article. The teams making good branded podcasts, the ones people actually finish and recommend to colleagues, aren't just measuring the show after the fact. They're reading the data to decide what to make next, which topics to double down on, where episodes drag, who's actually in the audience, and what those people keep asking for.
So let's get into it. Here are five ways to turn podcast data into content your buyers actually want to listen to, plus the charts, tips, and examples to show you the reality of this approach.
Quick note on what this post is (and isn't): This is the "now what do I do with it" guide. If you need the definitions first (what each metric means and where to find it), start with Podcast Metrics, Explained. If you're building a report to prove ROI to leadership, that's The KPIs Every Branded Podcast Should Monitor. This post is about using all of that data to make a better show.
TL;DR: Turning podcast data into better content
- Downloads tell you almost nothing about your content. They count who pressed play, not who stayed, who listened, or who it was. For content decisions, they're close to useless.
- Read your retention curve to find where listeners leave. The biggest drop is almost always in the first couple of minutes. Fix your cold opens and front-load the payoff at the timestamps where people dip.
- Let topic and guest performance write your editorial calendar. Rank episodes by consumption rate (not downloads), then make more of what earned attention and retire what didn't.
- Use audience data to choose your topics and guests. Company, role, and industry data tell you who you're actually reaching. Make content for that person, and check that they're your ICP while you're at it.
- Mine reviews, comments, and questions for episodes. Your audience will literally tell you what to make next. When the same question keeps showing up in communities and forums, that's an episode.
- Follow discovery and title data to curate episodes people click. Video is now how most people consume podcasts. Film it, clip it, and write titles around the specific problem you're solving.
- Make tracking a monthly habit. Build a routine around reading your podcast's data on a bi-weekly or monthly basis. This will make it much easier and less overwhelming when it comes time to build performance reports and guide editorial.
First, the mindset shift: Data is for editorial, not just reporting
Podcasting has a measurement reputation problem, and it's mostly deserved. For years, the default metric has been the download, and the whole industry now agrees on the punchline: downloads are an imperfect measure of success.
A download counts a file being requested. It doesn't tell you whether anyone listened, how long they stayed, or whether they were a decision-maker at your dream account or a bot in a data center.
So when brands say "we don't know if the podcast is working," what they usually mean is "the only number we look at is the one that tells us the least."
And luckily, a fix exists. It comes down to measuring the insights and data points that actually support creative decision-making.
For context on the audience you're making this content for: Edison Research's 2026 data puts monthly podcast consumption at 58% of Americans 12+, roughly 167 million people, and the way they consume has changed fast. A majority now both watch and listen, and YouTube has become the single most-used podcast platform. So to summarize, your buyers are pickier than ever about what earns their attention. And how do you figure out how to earn their time? Data.
Alright, let's get tactical.
1. Read your retention curve and fix where people actually leave
If you do one thing from this list, do this one.
Unfortunately, very few podcast hosting platforms give you consumption data (but CoHost does!). So if your host doesn't provide this insight, you'll have to go straight to the source, which is your Spotify for Creators and Apple Podcasts Connect account.
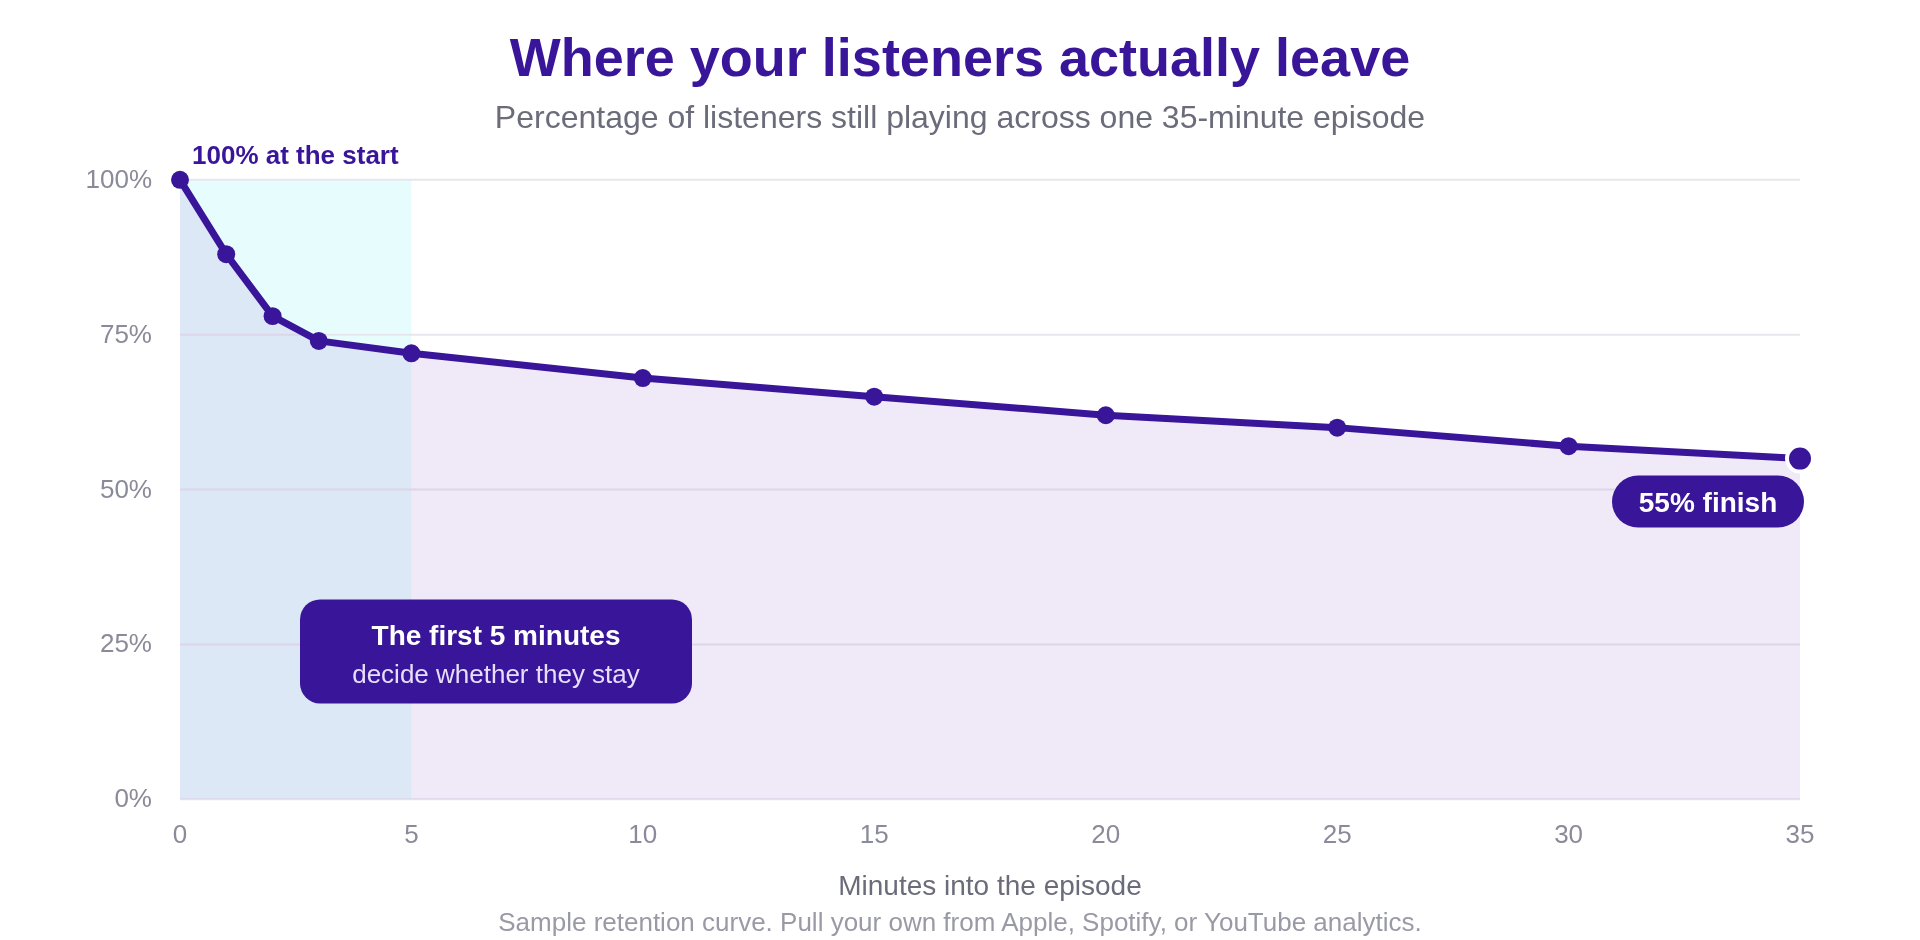
But what you're looking for is a graph or stats on how long listeners are sticking around for during each episode. Apple calls it consumption, Spotify shows you episode performance and retention, and YouTube gives you an audience retention curve for the video version. Whatever they call it, it's the single most useful content signal you have.
Once you can see your retention curve or the common areas listeners drop off, you can fix the content behind it:
- A steep drop in the first 60 to 90 seconds usually means your opening isn't hooking listeners by delivering a clear payoff or building interest. Cut the long "welcome back to the show, before we start, don't forget to subscribe" intro. Open on the single most interesting thing the guest said.
- A dip in the middle points to a section that drags. Go listen to what's happening at that exact timestamp. It's often a tangent, a long setup, or a stretch where the energy dies.
- A cliff right where your ad or mid-roll sits tells you the placement or the read is jarring. Move it, tighten it, or make it feel like part of the show.
Quill tip: Pull the consumption graph for your last five episodes and lay them side by side. If they all dip at a similar timestamp (say, right around the two-minute mark), that's not a coincidence; that's a format problem you can fix.
Brand example: A client's show kept losing about a quarter of listeners by the 2:00 mark. When we listened back, every episode opened with the same 90-second music-and-housekeeping intro before the guest said a word. We cut it to a 15-second cold open built around the guest's sharpest line, and the early drop shrank noticeably in the following months. Same content and type of guests; the difference was that we started hooking listeners at the very start.
2. Let topic and guest performance write your editorial calendar
Most brands plan episodes based on who says yes and what feels interesting that week. To be frank, your data does better than a vibe.
Rank your back catalogue by consumption rate (the share of the episode the average person listens to), not by downloads. Downloads mostly measure your promotion for that week. Consumption measures whether the content actually captured people. A big topic can pull a big download number and still bore everyone who showed up, and you'd never know if downloads were the only thing you looked at.
Then look for the pattern in your best performers.
- Is it a topic?
- A guest type?
- A format (solo vs. interview, tactical vs. big-picture)?
Make more of that, and retire the themes that consistently underperform.
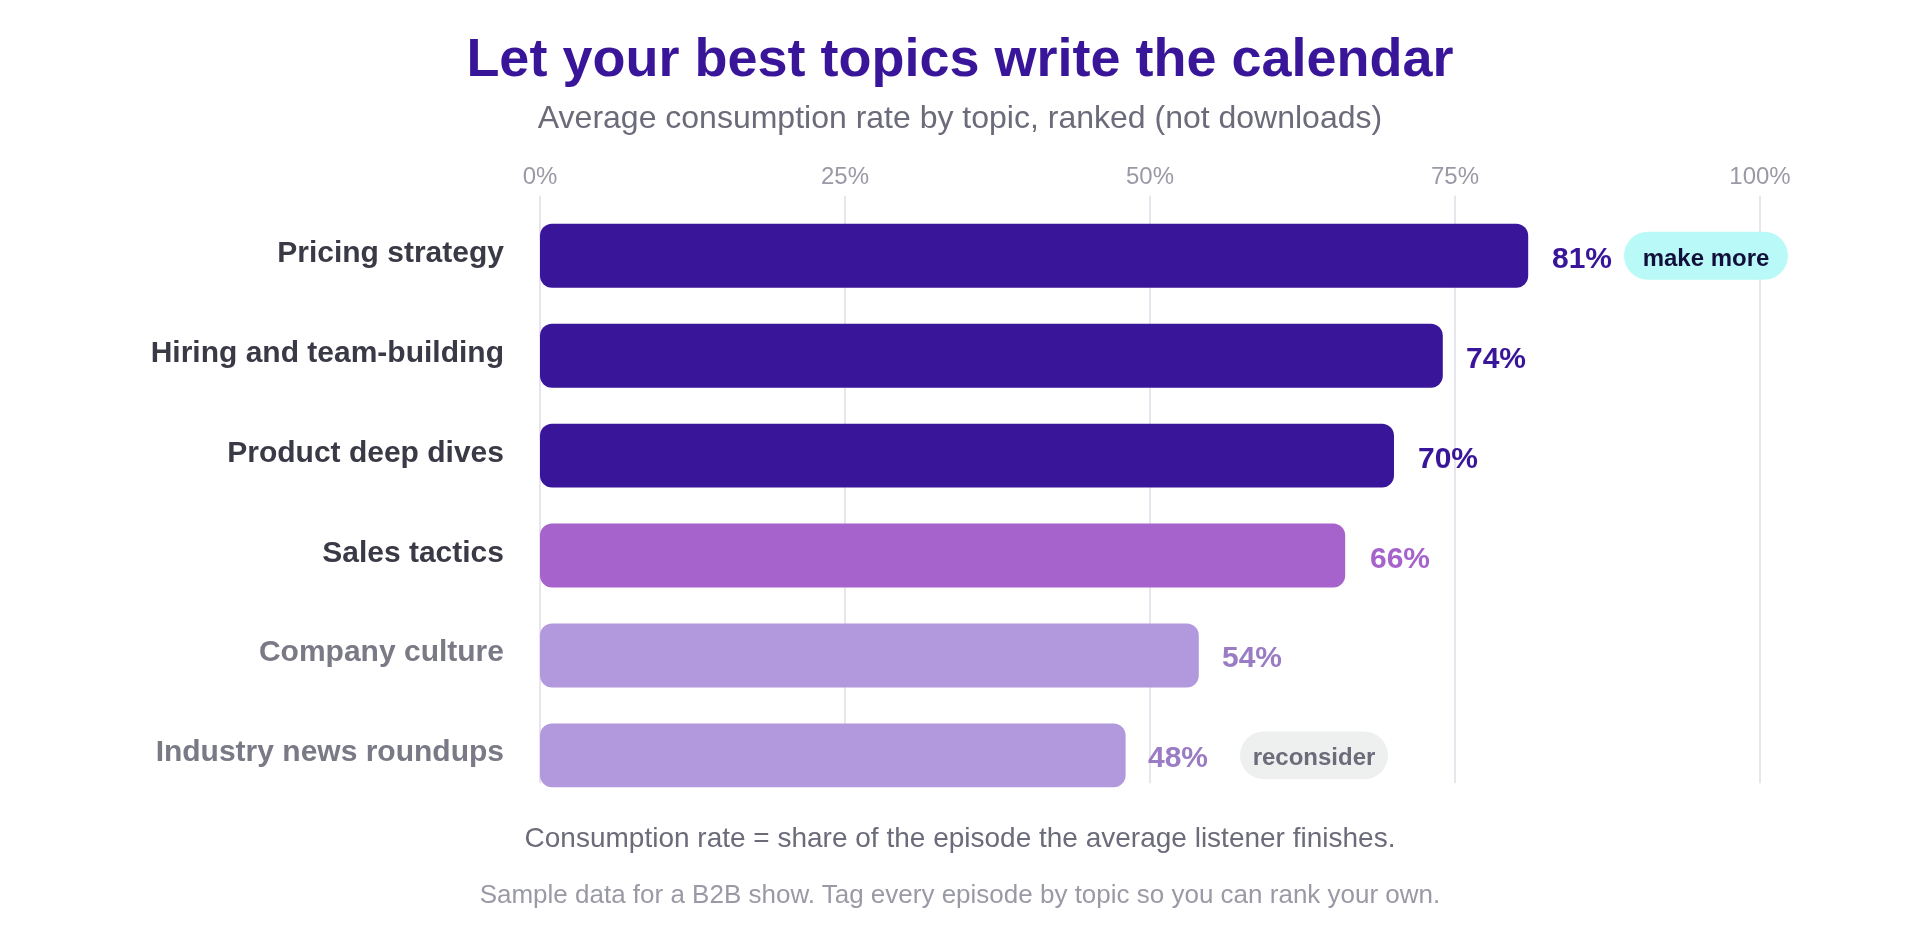
Brand example: Say you run a show for revenue operations leaders. You line up the last twelve episodes by consumption rate and notice the three about pricing and comp all sit near the top, while the two "state of the industry" round-ups sit at the bottom. That's your content clearly telling you something: your audience shows up for tactical, decision-level topics, not the news they can get anywhere. So with this data, you confidently book two more pricing episodes and swap the next news recap for a teardown.
Quill tip: Tag every episode with its topic, guest type, and format in a simple spreadsheet from day one. It feels like busywork for the first few months, but it's an easy way to actually segment performance later. You can't spot "pricing episodes outperform culture episodes" if nothing is tagged.
3. Use audience data to choose your topics and guests
This is the play that's specific to B2B, and it's the one I get most excited about (data is my favorite topic, so bear with me).
Standard analytics tell you how many people listened (downloads... I'm looking at you). What actually shapes your content is knowing who your listeners are:
- Which companies they work for
- What industries they're in
- The job roles they hold
- How senior they are
That's company-level listener data, and it changes what you make.
A few ways to put it to work:
- Make content for the role that's actually listening. If your audience skews toward ops managers at mid-market SaaS companies, make episodes for ops managers, not the CFO you imagined when you launched. Match the content to the room you've actually built.
- Check that the room is the right room. If your show set out to reach heads of marketing but your listener data is full of students, job-seekers, and competitors, your topics are attracting the wrong crowd. That's now a content correction: get narrower, more senior, and more specific with your editorial.
- Book guests who speak to your most common listener. When you can see the roles in your audience, you can book guests those exact people would want to learn from.
This is exactly why we built CoHost, our branded podcast growth platform. Its B2B Analytics feature surfaces the companies, industries, and roles behind your audience, so you can answer the question that should drive half your editorial decisions: are the right people listening, and what type of content do they care about?
Brand example: A brand hosts a podcast about marketing in the world of FinTech. The target audience is marketers at small-to-medium FinTechs who are Senior Managers+. After releasing a handful of episodes, the brand realized that although episodes covering FinTech marketing trends had the most downloads, the episodes that spoke to the restraints and legalities around marketing in the industry actually received the most listens from their core ICP of decision-making marketers at FinTechs. Without the insight of who is listening, that brand would never know the type of content that performs better.
Quill tip: Once a quarter, pull your top listener companies and most common job titles, then book at least one guest who speaks directly to that role. If half your audience is people-ops leaders, an episode with a respected CHRO will out-earn a generic "leadership" episode.
4. Mine reviews, comments, and questions for future episodes
Not all of your best data is quantitative. Some of the most useful content signals are sitting in plain language, in places you might not be checking.
Your audience is telling you what to make... okay, maybe it's not that simple. But there are ways to gather insights and content direction from your listeners.
Areas to look at are:
- Reviews and ratings on Apple and Spotify (what people love and want more of).
- Comments on YouTube and Spotify, which can be a great source for episode ideas.
- Replies to your podcast newsletter and the LinkedIn posts where you share episodes.
- The questions your guests keep getting asked, on the show and off it.
- Relevant communities and what your target audience keeps asking about.
To dumb it down: recurring questions are episodes. When the same question or topic keeps surfacing in the above channels, build an episode around it! Yes, it's that easy.
Brand example: A staffing & recruiting company has a podcast covering HR tech. They had a highly engaged audience, and after each episode, there was typically some conversation happening within their comments feed on YouTube. After each episode, they’d pull questions their audience brought up and build those into fresh content.
Quill tip: Keep a running "listener questions" doc (a note, a Slack channel, a spreadsheet, whatever you'll actually use). Every time a question or comment shows up more than once, log it. Once something has been repeated, maybe more than three times, have it graduate to the content calendar. It's the lowest-effort idea engine you'll ever build, and the ideas are pre-validated by the exact people you're trying to reach.
5. Follow discovery and title data to package episodes people click
You can make the best episode of your life, and if nobody clicks it, the retention curve never gets a chance to matter. So the last data-to-content play is all about packaging, basically how people find, choose, and consume your episodes.
Two things have changed enough since we wrote this article originally in 2023:
1. Video is now the default, not the bonus
Per Edison Research's 2026 findings, a majority of podcast consumers now both watch and listen; audio-first consumption has fallen from 71% in 2022 to around 51%, and YouTube has become the most-used podcast platform for weekly listeners. What that means for your content: film the show (it doesn't need to be documentary-level production) and cut vertical clips.
2. Get specific on your titles
Episode title and search data show you what people actually click. YouTube hands you click-through rate directly, and even audio platforms show which episodes over- and under-index on new listeners. But what we're commonly seeing is that specific beats clever. "How Stripe prices new products" will out-click "A conversation about pricing" every time, because it names the exact thing your buyer is stuck on.
Quill tip: Before you publish, write three title options and pick the most specific one, not the most clever. Then check your discovery data a month later and see which episode titles pulled the most new listeners. Do more of whatever that format was.
The data-to-content podcast loop
Here's the thing that ties all five plays we discussed above together. None of them work as a one-time audit. They work as a continuous loop you run every month: publish, read the data, decide what to change, make a better episode, repeat.
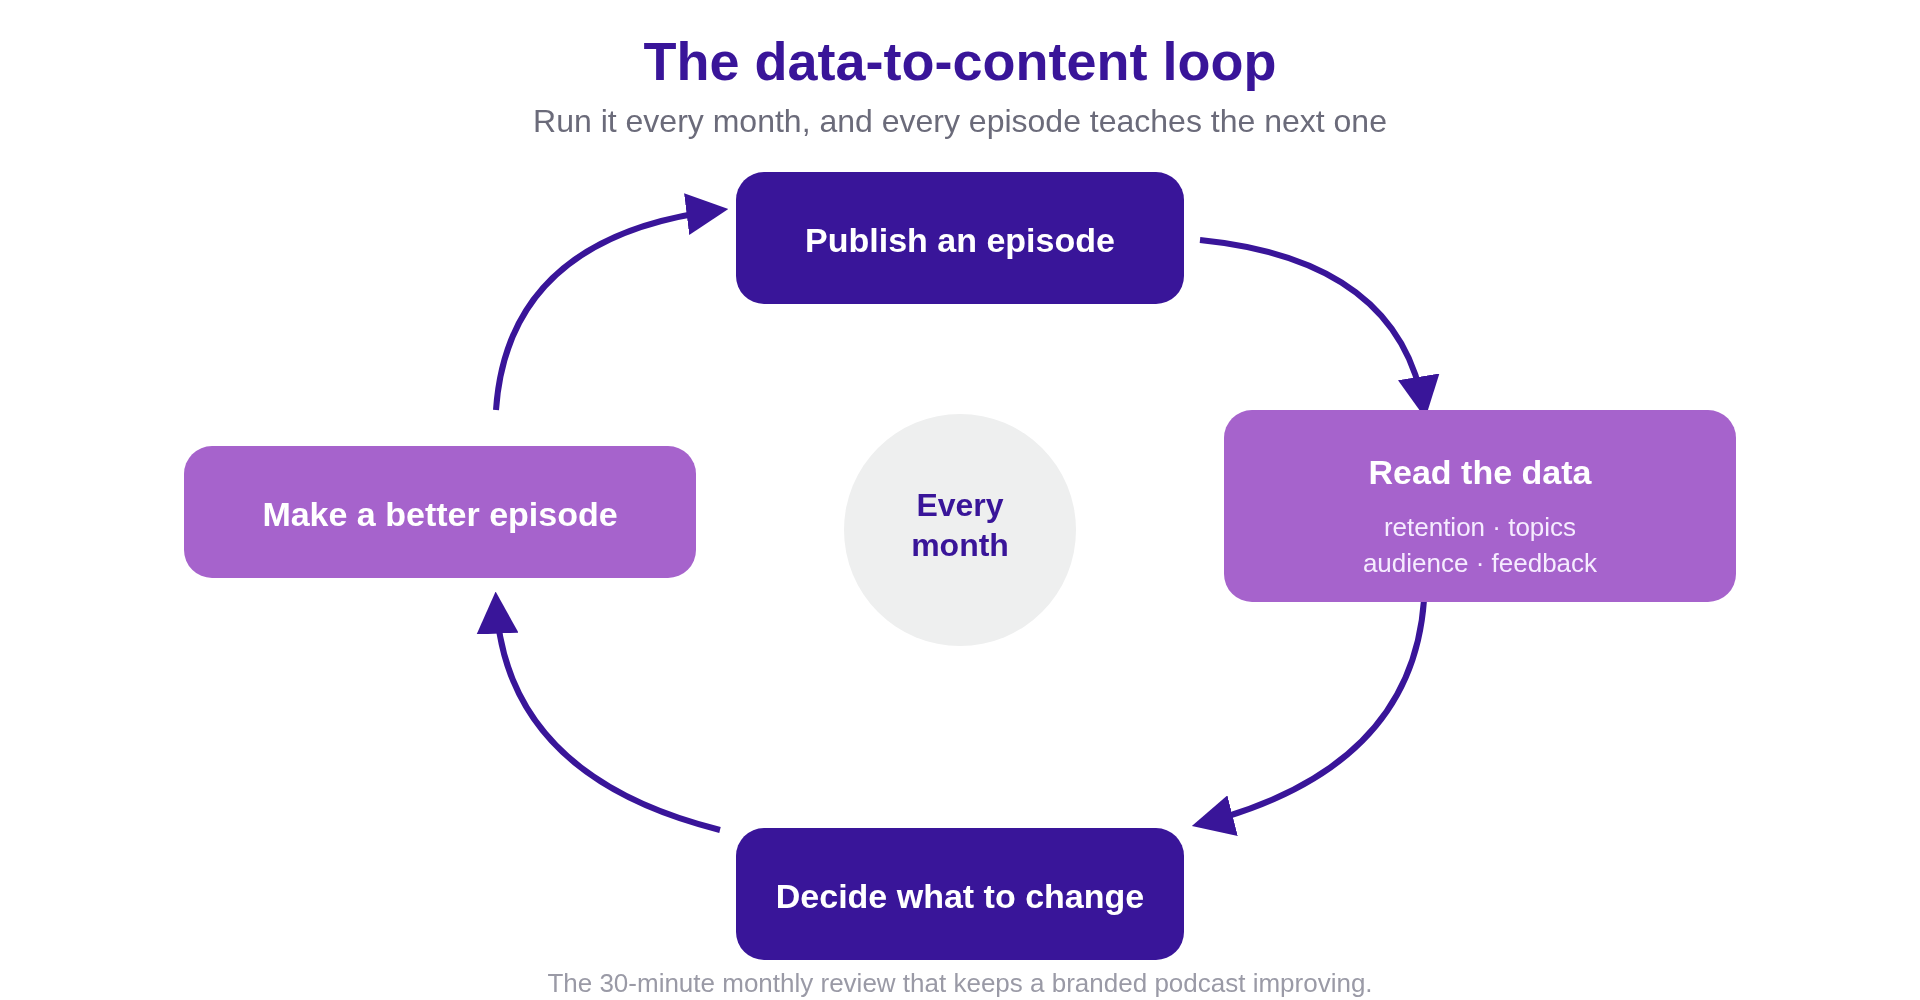
And after years of producing podcasts for brands, we've found that the ones that succeed are the ones that close this loop consistently. Every episode teaches you something about the next one, but only if you actually read through and understand the insights.
If I were a marketer running a podcast channel for my brand, here's the monthly review I'd run. It takes roughly 30 minutes:
- Retention: Pull the consumption curve for the month's episodes. Where's the common dip?
- Topics: Rank the month by consumption rate. What earned attention, what didn't?
- Audience: Check your top listener companies and roles. Still your ICP? Any surprises?
- Feedback: Skim reviews, comments, and replies. Log any repeat questions.
- Discovery: Note which titles and clips pulled the most new listeners.
- Decide: Write down two changes for next month. Just two; we don't want to get overwhelmed. And then actually make them.
Quill tip: Protect this 30 minutes like a standing meeting. The teams that skip it aren't lazy; they're busy, and "read the podcast data" is always an item that keeps getting pushed back. I've seen teams add it as a recurring meeting to ensure they actually get it done.
What "good" looks like with consumption benchmarks
Leadership loves to ask, "Is that number good?"
And my honest answer is usually that every show is different, and format drives a lot of this, so it's hard to accurately benchmark yourself. But here are some rough ranges for the content-quality metric that matters most: consumption rate (how much of an episode the average listener actually finishes).
But don't panic if you're above or below. Use it as a directional gut-check, and watch your own trend over time more than the benchmark.
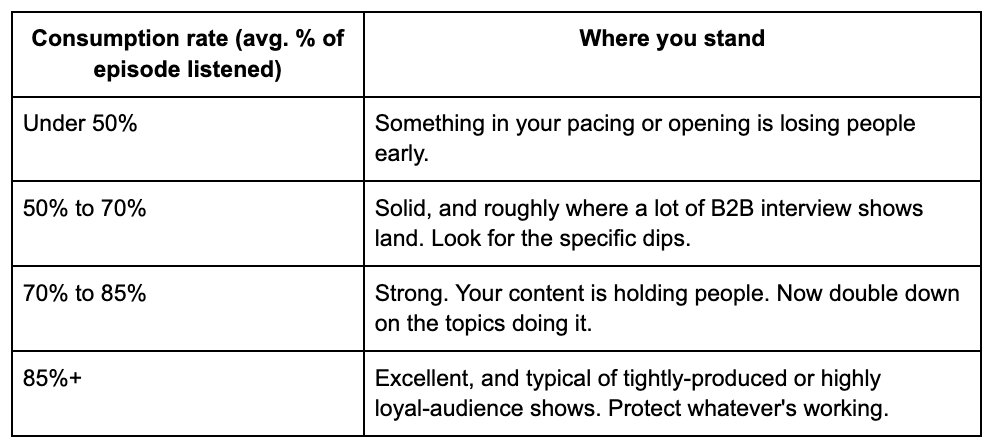
For a sense of the wider field, industry data generally puts average episode completion somewhere in the 60% to 85% range depending on format and length, with completion tending to slip on episodes past the hour mark unless your audience is deeply loyal.
FAQ
What podcast data actually helps you make better content?
The most useful content signals are consumption and retention (where people drop off within an episode), consumption rate by topic and guest (what holds attention), company-level audience data (who's actually listening), and qualitative feedback (reviews, comments, and recurring questions). Downloads are the least useful signal for content decisions, because they count who pressed play, not who stayed or who it was.
What's a good podcast consumption or completion rate?
It varies by format and length, but industry data generally lands average completion in the 60% to 85% range. For a B2B interview show, a consumption rate of 50% to 70% is solid, 70% to 85% is strong, and anything above that is excellent. More important than the benchmark is your own trend: is your consumption rate climbing as you tighten your episodes?
How do I find out where listeners drop off in an episode?
Most major platforms give you a retention or consumption curve. Apple Podcasts shows consumption, Spotify shows episode retention, and YouTube gives you an audience-retention graph for the video version. Pull the curve for your recent episodes and look for the steepest drop, which is almost always in the first couple of minutes, then go listen to what's happening at that timestamp and fix it.
Should I use downloads to decide what content to make?
No. Downloads mostly reflect how hard you promoted an episode that week, not whether the content was any good. To decide what to make more of, rank episodes by consumption rate and by how many of the right companies they reached. A show that pulls big download numbers but low completion is telling you the packaging worked, and the content didn't.
How often should I review my podcast data for content decisions?
At least monthly. A 30-minute review each month (retention, top topics, audience, feedback, and discovery) will improve your show far more than a big annual audit. The goal is to close that content loop while the lessons are still fresh enough to change the next batch of episodes.
How do I use audience data to pick topics and guests?
Look at the companies, industries, and roles in your audience, then make content for the person who's actually showing up. If your listeners skew toward one role (say, people-ops leaders), book guests and choose topics that role would obviously want to listen to. Tools like CoHost's B2B Analytics surface that company and role data, so your editorial calendar is built around your real audience instead of the one you imagined at launch.
Your dashboard is full of your next ten episodes
The brands with the best branded podcasts aren't the ones with the fanciest gear or the most famous hosts. They're the ones who treat their data as a creative tool, not just a reporting one. They read the retention curve, they follow the topics that land, they make content for the people actually tuning in, and they turn every recurring question into an episode.
You don't need a bigger budget to start. You need to open the dashboard with a different question. Not "how did we do?" but "what should we make next?" The answer is almost always right there.
At Quill, we produce branded podcasts for enterprise brands like PwC, Expedia Group, and UKG, and we run the full lifecycle from the first strategy call to the audience data that decides what we make next. If you want a show that gets sharper every month and saves you and your team time and resources, chat with our team.
And if you want more of this (branded podcast data, tactics, and the occasional strong opinion), sign up for our bi-weekly newsletter, The Branded Podcaster.
Share
About the author

A passionate storyteller, Ali is Quill’s Director of Growth Marketing, previously the co-founder and CMO of the branded podcast agency, Origins Media Haus (acquired by Quill). She excels in merging creativity with data in order to successfully build and grow a brand.


.png)


.png)
.png)
.png)
.png)